- Print
- DarkLight
- PDF
Use the Audience > Overview report to segment users by subscription plan, campaigns, and other dimensions for defined time period.

On the top of the Overview report is a quick view of the Top 6 Subscription Plans. To see the full breakdown of the subscription plans, go to the Subscription Plan tab.
| Icon | Name | Description |
 | Graph view | View data points on a chart - point your mouse over the dotted points to view the numbers. |
 | Tabular view | Display data points in a row format. |
 | Download button | Download the report as an Excel file. |
Overall
Segment users based on these metrics.
| Metric | Description |
|---|---|
| Registered Users | All users who have created an account with your service. The difference between the aggregate of Registered Users of any two days tells the number of Registered Users you've gained over the time period. |
| Subscribed Users | Includes all types of subscribers (Users in completed, deferred_cancellation, paused, and hold are all subscribers). (SVOD-only) |
| Active Users | If a user has done some activity on the web or app (for example, watched a video), then the user is considered an active user. We count it as an action only when a user watches a video, page click alone will not be considered an active user. You can derive the DAU, WAU, and MAU using the date range and the Active Users metrics:
Note:
|
| Active Registered Users | Registered users that have watched at least one video on your site or apps in a given time frame. |
| Active Subscribed Users | Active Subscribed Users = Previous Month Active Subscribers + Acquisition happened for the date range - Churn happened in that date range + Re-subscriptions |
Active Users
The default view of active users doesn't show the total number of users for the month

To get the active users for the whole month, use this method:

Or, use the bar chart:

Active User Reporting Query
Let's take the example of the following numbers of active subscribers, churned users, new acquisitions, and resubscribed users and learn how to calculate active subscribed users:
Previous Month Active Subscribers | Acquisition | Churn | Re-subscriptions | |
| November | 520 | 830 | 217 | 18 |
| December | 1151 | 1217 | 558 | 57 |
Active Subscribers = Previous Month Active Subscribers + Acquisition happened in the current month - Churn happened in a current month + Re-subscriptions of the current month
For November: 1151 = 520 + 830 -217 +18
For December: 1867 = 1151 + 1217 -558 + 57
What are "Secondary Metrics"?
The chart work area lets you visualize a dimension with two metrics at a time for wider reporting. Pick an additional metric from the Secondary Metrics list, and compare it with the primary metric side by side. The UI elements are highlighted in orange boxes in the image below.
.png) Visualize two metrics in the same graph
Visualize two metrics in the same graph Acquisition Campaign
This section has two conversion metrics in addition to the above in the Overall section.
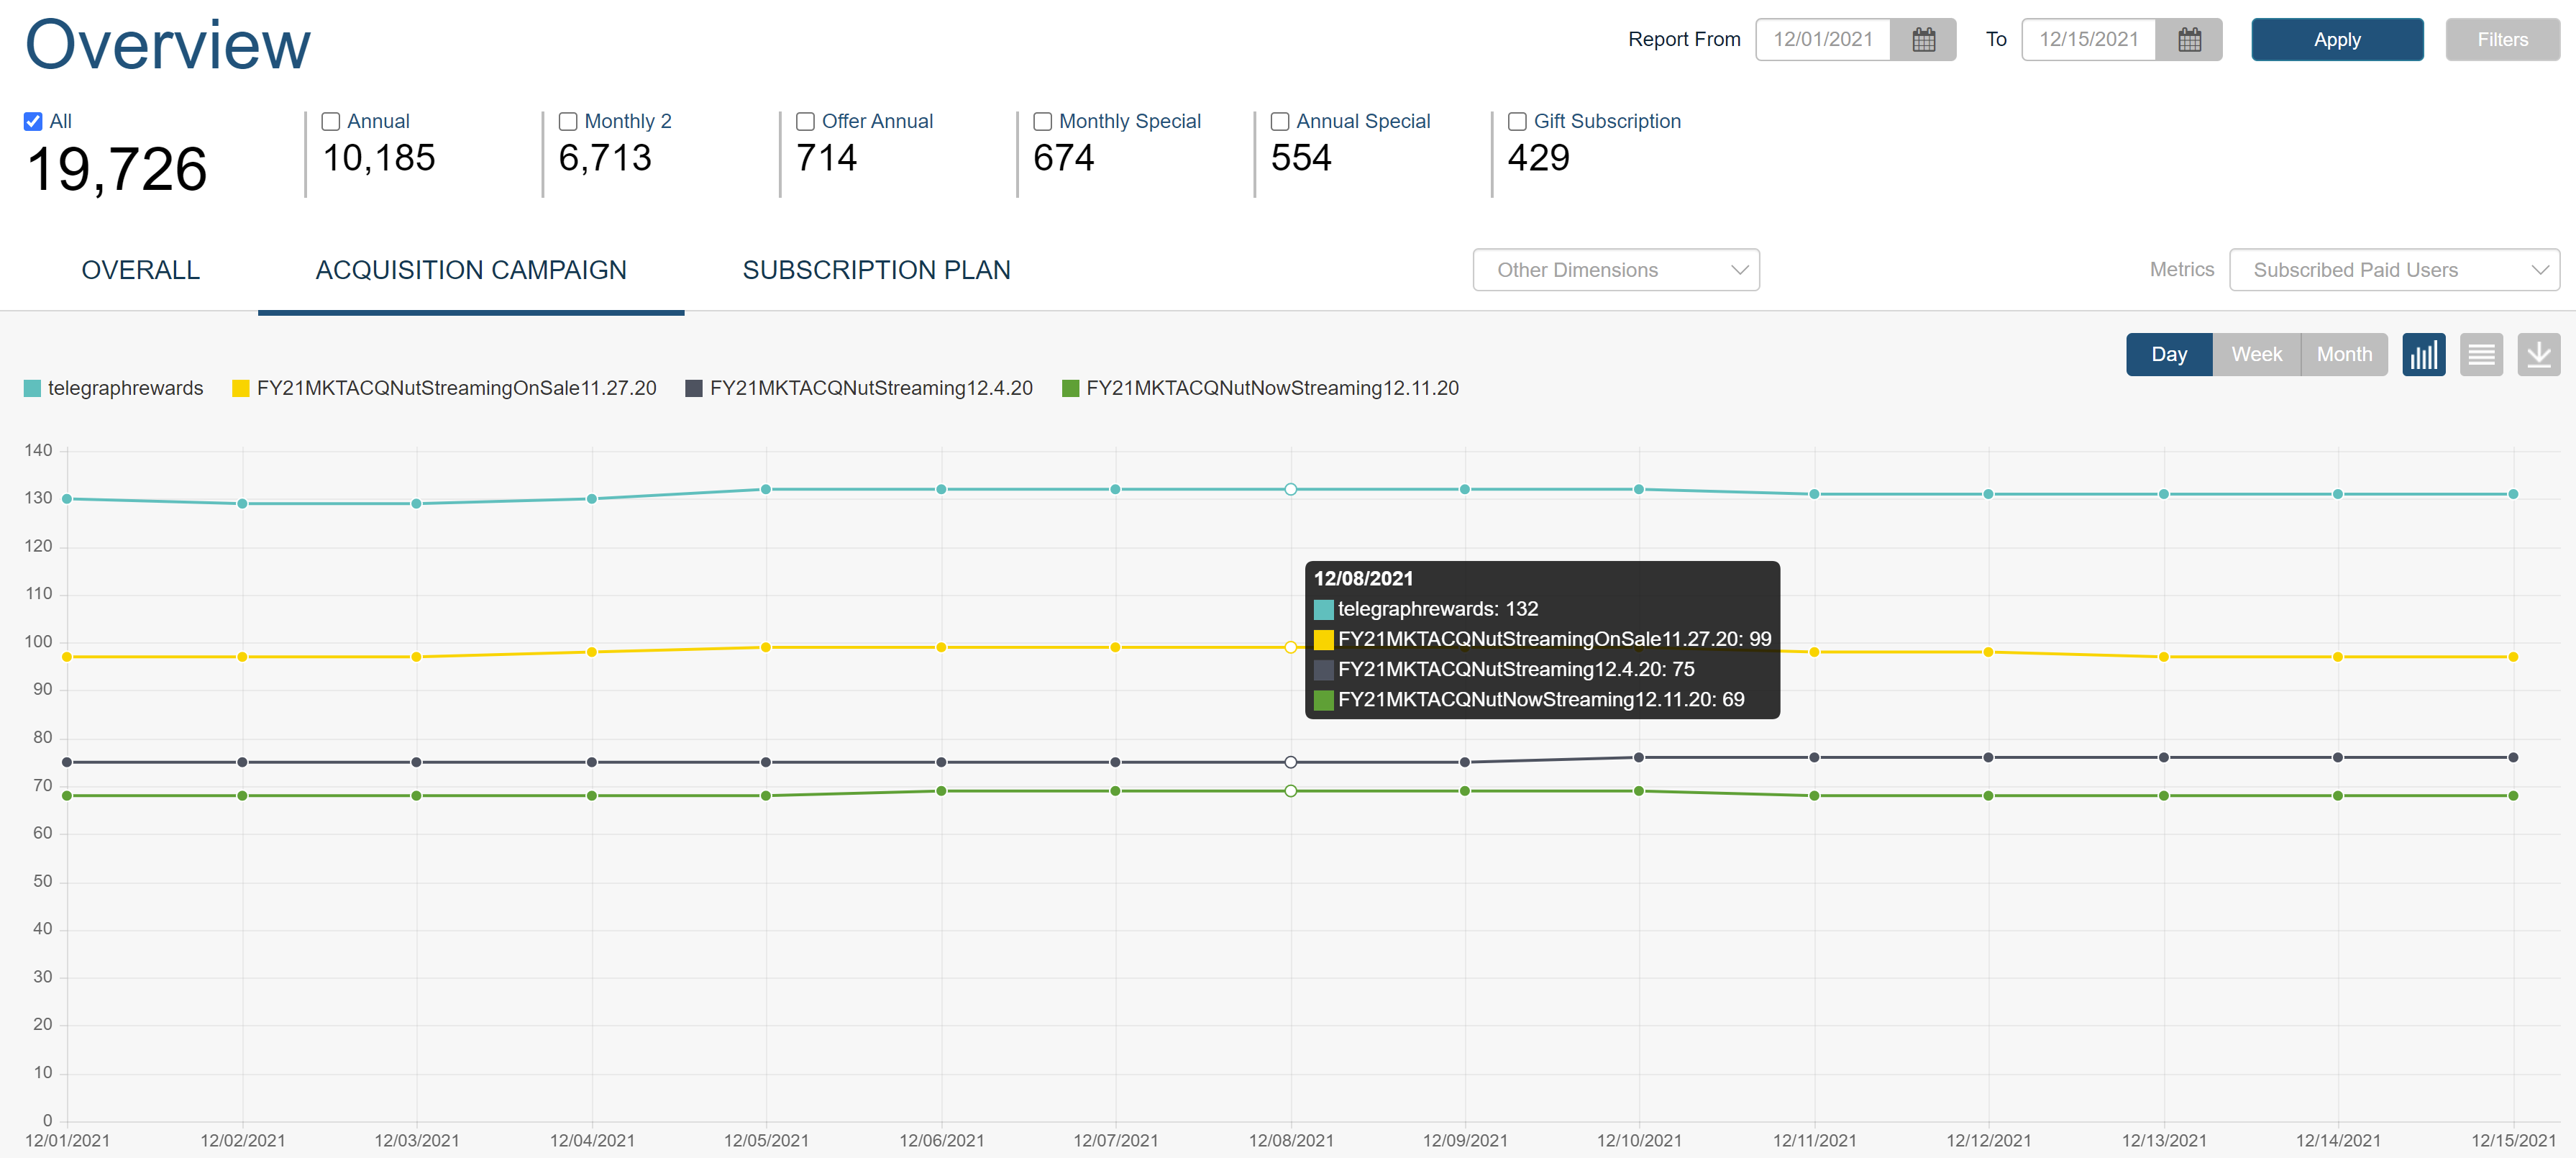
| Subscribed Paid Users | Paid subscribers gained over time. Subscribed Paid Users = Newly subscribed users + Resubscriptions + Subscriptions after trial + Recurring users - Churned users |
| Subscribed Free Trial Users | Conversions at the end of the free trial period. |
The graph shows the top four campaigns for the report range.
 Subscriptions acquired via campaigns for the set report range
Possible errors:
"No records are available!"
We capture UTM in our cookie so it will be recorded in our system as well as in GA/Firebase.
If you've created campaigns in Google/Facebook, ensure that you are sending campaigns with utm_source, utm_medium, and utm_campaign params. Also, ensure that your Google Analytics and Social accounts work together for accurate reporting. The utm_campaign must contain the campaign value you have set in the plan. For more information, see this Google article.
"Most of the traffic belongs to ‘no campaign’ in the Campaign section."
Check your GA dashboard, if most of the campaign events are triggered without the required parameters, this is happening because of the normal login/signup. As per the current implementation of the UTM, a campaign event is only triggered when the user clicks on the campaign link and then proceeds toward the login/signup process. In the case of normal login/signups (where no campaign URL is involved), these UTM params are passed as undefined/none. Hence, the data of only campaign users will be shown in the tools Audience > Acquisition > Campaign section.
What is the UTM campaign link structure with params coming in the Deeplink URL so we can send it to Google Analytics for tracking?
Here's a sample URL: https://www.abcdtv.com/home?utm_source=email&utm_medium=main&utm_campaign=campaign_name
Subscription Plan
View paid subscriptions by subscription plan over a defined timeframe.

Other Dimensions

| Other Dimensions | Description |
|---|---|
| Payment Handler | Pivot the data by payment handlers that you have enabled in the AppCMS Settings. |
| Country | Gives a geographic overview of your audience. Age and gender are not captured in the ViewLift dashboard. However, you can get this report in your GA/Firebase dashboard, it is captured in the Analytics > Audiences report. You will need to enable this feature to be able to see the data. |
| Campaign Source | Displays the source of the traffic for your site or app. Your traffic can come from people searching your site from search engines, or socials, or other websites. When there is no information on the traffic origin, then the source is known as Direct. Examples include when someone typed your URL into a browser, clicked a bookmark, or came from an offline tool or document on your computer (if tracking has not been set up). If it’s not direct, it should be the name of a site. |
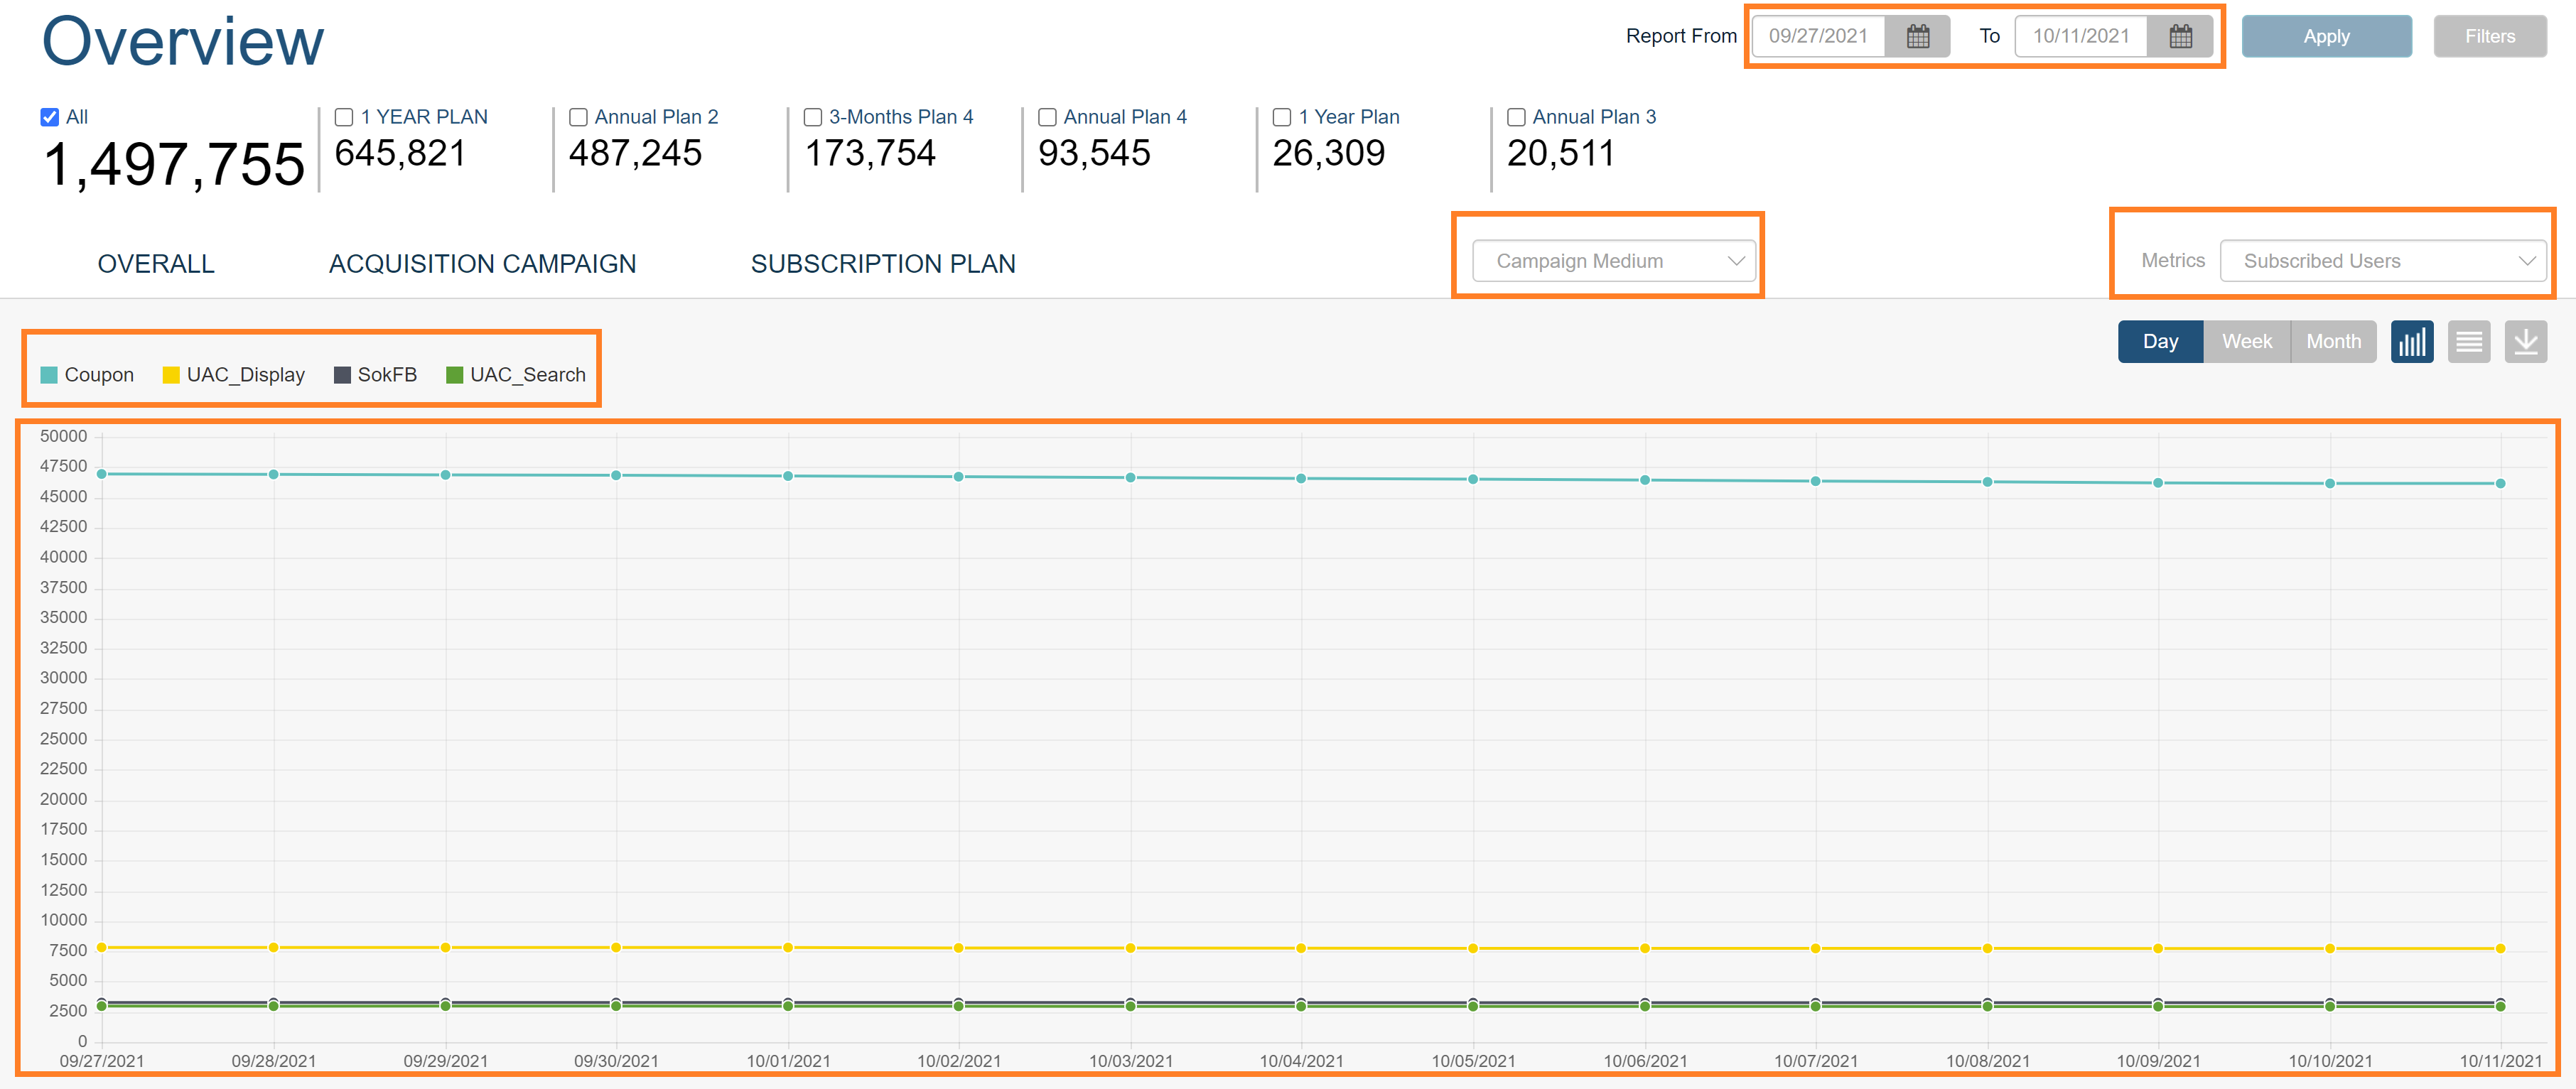
| Campaign Medium | A Campaign Medium report is generated using the data captured through UTM codes in your UTM campaigns. Some of the common campaign mediums are Google, Facebook, and Twitter. For more information, see this Google article. Campaign Medium tells how your website’s traffic arrived at your site. A medium can mean any of the following:
|
| Plan identifier | Filter user data by plan identifier. |
 Audience report showing SVOD subscriptions gained through Campaign Medium
Multi Filter
The Filters menu appears in the upper-right corner in the following sections of Dashboard 360: Audience, Behavior, and Content.

Use filters to narrow down your data further to some specific search criteria. For example, you might want to find the number of annual subscriptions paid via Amazon IAP.

FAQs - Audience > Overview
Q. What is the difference between Active Users and Streaming Users?
A. In Audience > Overview, we get the unique active users(for that day) who watched the content In the Video Engagement - we get the unique active users per platform (for that day) who watched the content. The reason for the small difference (slightly higher number in the Video Engagement) is that if a user watched on two devices (Roku and Apple TV), then that user is counted as a unique user on both Apple TV and Roku. But in the Audience Overview, the user is counted only once. This happens when the user switch may switch between device platforms for watching content on a given day.
.png)
