Dashboard
- 16 Mar 2024
- 4 Minutes to read
- Contributors

- Print
- DarkLight
- PDF
Dashboard
- Updated on 16 Mar 2024
- 4 Minutes to read
- Contributors
- Print
- DarkLight
- PDF
Article summary
Did you find this summary helpful?
Thank you for your feedback
In the OTT business, analytics reviews are crucial to shaping your content and subscription strategy. Looking at your acquisition metrics, for example, you can begin to identify what type of subscription plans, campaigns, and offer codes perform best with your users. Or maybe you look at your QoSS metrics and discover that certain apps are your top drivers of streaming issues, and then you can focus on debugging any underlying issues.
To learn more about these analytics and know why it's important, let’s look at the metrics available in ViewLift's Dashboard 360 Analytics. These metrics can be used to track progress against your business objectives, like increasing user engagement, reach, and revenue.
About ViewLift's Analytics
When you first log in to the ViewLift platform, what you'll see is the Dashboard 360 Analytics. It provides a quick overview of the metrics that you care about most. ViewLift's own back-end analytics directly tracks user and player events at defined intervals across all streaming platforms, aggregates the data, and presents them as historical reports in Dashboard 360. Aside from native analytics, we also pass our beacon events to third-party analytics of your choice such as Google Analytics, Clevertap, Facebook Pixel, and more.
.png) Dashboard analytics landing page for a subscription-based (SVOD) platform
Dashboard analytics landing page for a subscription-based (SVOD) platformDashboard screen details
- Date range selector

To select and compare date ranges, use the date range selector at the top right of the Dashboard. The date range you set in the Report From and To fields is compared against the same number of days before that date range. The resulting number is color-coded as green or red-green indicating that a metric is healthy, and red indicating a metric requires detailed analysis.
Select one of the options from the Date Range menu:
- Default: The date range by default displays the report for the last 15 days including the current date.
- Custom: Define your date range to retrieve data for that time frame.
The dashboard, by default, shows the reports day-wise, you can also view them on weekly and monthly presets. The Weekly reports are based on Monday–Sunday, with Monday being the beginning of the week. The monthly report will include reporting for the full month. - Subscribers
.png) Subscribers include users in the free trial, completed payments, deferred cancellations paused, or held statuses. The previous Subscribers number is inscribed in gray above the pie chart. The percentage increase or decrease is based on comparing cumulative subscribers between the previous and the current date ranges. The graph adjacent to the pie chart displays the same data in a bar graph. Choose Week or Month to view weekly/monthly grouped data.
Subscribers include users in the free trial, completed payments, deferred cancellations paused, or held statuses. The previous Subscribers number is inscribed in gray above the pie chart. The percentage increase or decrease is based on comparing cumulative subscribers between the previous and the current date ranges. The graph adjacent to the pie chart displays the same data in a bar graph. Choose Week or Month to view weekly/monthly grouped data. - Payments
Transaction data are shown based on the direct subscriptions in the completed status on the platforms where sales have happened. This includes country-specific plans, displaying the total transaction amount in the relevant currency. Note that there won't be any earnings or payments on your apps where you don't have a Direct-to-Consumer (DTC) plan, for instance, your Xbox app may not have an in-app subscription plan and still allow existing users to log in with the same credentials on your Xbox platform. - Acquisitions
Conversion of free subscribers into paid subscribers. Data is compared against the same period before the specified date range. - Churn
The user churn rate over a timeframe. This includes subscriptions that are canceled, disabled, and refunded. - Streaming Users
The total number of free and paid streaming users across all your supported platforms. - Total Streaming Duration
The total number of streaming duration (in minutes) on your apps on all platforms. - Total Page Views
A pageview (or pageview hit, page tracking hit) is an instance of a video page loaded (or reloaded) on your website or m-browser; page views of the other platforms are not included.
Note This is Google Analytics data, so you must be signed in with the Gmail account that has permission to view this data, also we show only the Top 6 page views in this table. For the full report, please visit your GA dashboard. - Top Plans
Displays the top SVOD plans and your total subscriber count. - Top Content
Most-streamed videos (top 6) on your site. - Top Page Views
Page views for the most viewed pages on your website. This is web and m-web-only data. Use your Google Analytics handle for the full report.

.png) Subscribers include users in the free trial, completed payments, deferred cancellations paused, or held statuses. The previous Subscribers number is inscribed in gray above the pie chart. The percentage increase or decrease is based on comparing cumulative subscribers between the previous and the current date ranges. The graph adjacent to the pie chart displays the same data in a bar graph. Choose Week or Month to view weekly/monthly grouped data.
Subscribers include users in the free trial, completed payments, deferred cancellations paused, or held statuses. The previous Subscribers number is inscribed in gray above the pie chart. The percentage increase or decrease is based on comparing cumulative subscribers between the previous and the current date ranges. The graph adjacent to the pie chart displays the same data in a bar graph. Choose Week or Month to view weekly/monthly grouped data.AVOD-specific analytics
AVOD analytics excludes subscription-related reports.
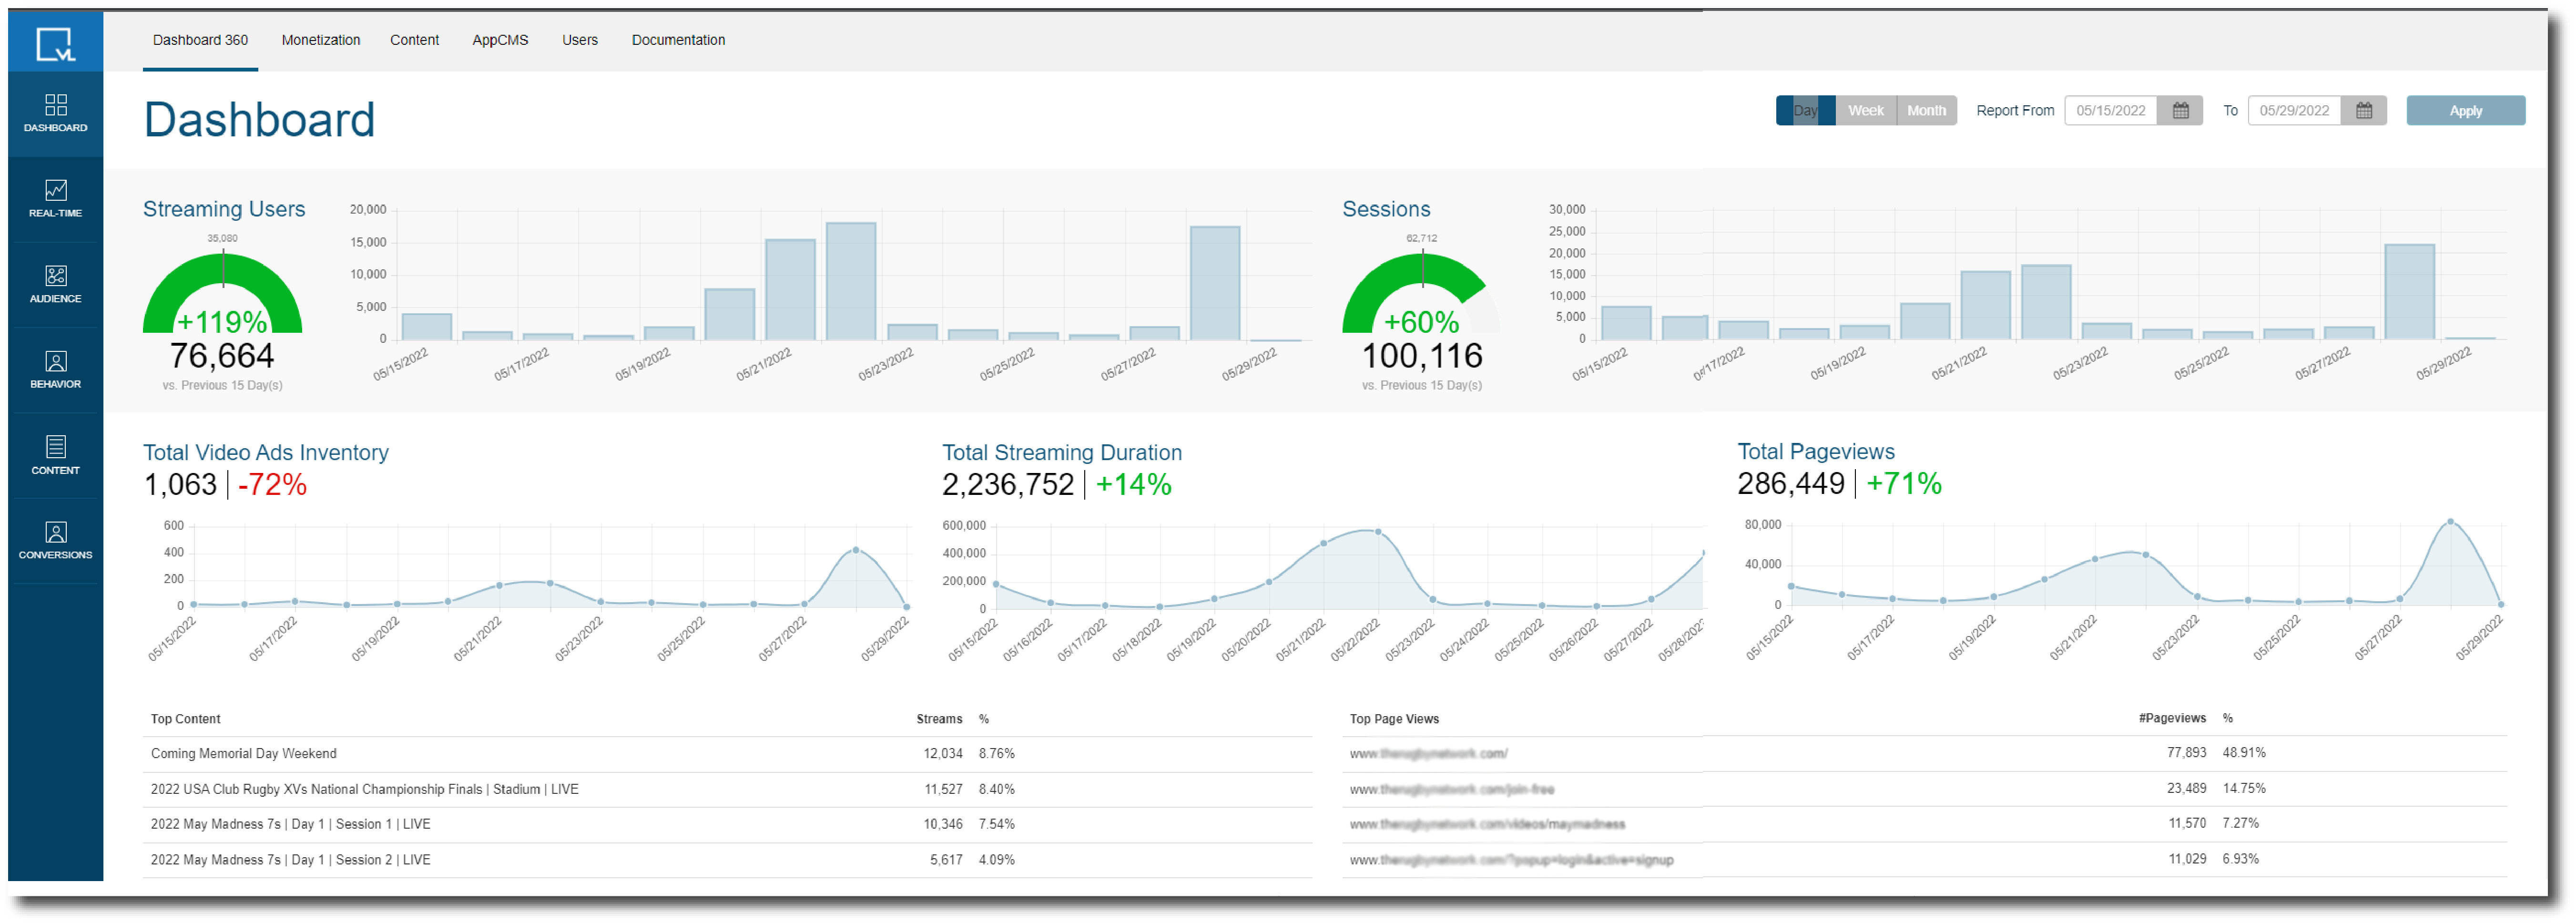 Dashboard analytics metrics for an Advertising-VOD platform
Tracking Guest Users in AVOD Service with Anonymous API
If your platform allows users to access content without registration, our Anonymous API tracks the guest users using their Device IDs. The beacon API is triggered every 30 seconds, and this time interval can be adjusted from Feature settings: Enable Analytics Beacon Capture Interval (Seconds). Additionally, QoS analytics can be activated by enabling Enable QoS.
For AVOD service with registration and login enabled, the Player beacon tracks registered users with their profile ID and guest users using Device ID.
The following metrics are shown on the Dashboard 360 page:
Streaming Users
The total number of streaming users for a specific period.
Sessions
Activities are monitored by sessions. This means it tracks user actions and behavior within a specific timeframe (e.g., while they have your app open or are browsing your website). Logout and New Session: When a guest user logs out, the Anonymous API creates a new session for subsequent visits. Each visit is tracked independently.
Total Streaming Duration
The total number of streaming duration (in minutes) on your apps on all platforms, calculated as Total Runtime * Number of plays for a period.
Total Video Ads Inventory
(AVOD-only) Displays the total ads inventory that is configured via the Ad tags added in ViewLift tools.
(AVOD-only) Displays the total ads inventory that is configured via the Ad tags added in ViewLift tools.
Was this article helpful?